
10 Mar 2026
Industrial Technology Valuation Update | Q1 2026
After the 2022–2023 reset, Industrial Technology valuations have rebuilt decisively, with the sector trading at 16.7x EV/EBITDA in Q4 2025 — clearly above the four-year average of ~14.2x and ~17% ahead of prior year. But the headline multiple is not the story. Dispersion remains the defining characteristic of the market: Industrial Software, Control Tech, Robots / Motions, Sensors & Vision Tech and Integrated Conglomerates command high-teens to low-20s multiples, driven by double-digit growth, expanding margins and recurring revenue, while Machinery and Engineering/SI trade at a structural discount, weighed down by single-digit to low-teens EBITDA margins, volatile project economics and disproportionate Automotive exposure. The business model and the customer base together determine where a company sits in that range — not the sector label.
Our growth-vs-profitability analysis confirms what the multiples already imply: investors reward both dimensions equally. Companies delivering above-average sales growth and EBITDA margins above 25–30% consistently sit at the top of the valuation range — those that underdeliver on both fall below 8x regardless of what they call themselves. End market exposure has emerged as an equally decisive factor: sub‑sectors tied to Semiconductors (~21.8x) and Building‑related applications (~18.1x) benefit from structurally non‑deferrable, often regulation‑driven capex, with Diversified and Infrastructure exposures trading in the mid‑teens; Automotive‑ and Food & Beverage‑heavy segments sit closer to 8x, a discount that the revenue model alone cannot overcome.
For entrepreneurs and sponsors, the implication is direct: premium multiples in Industrial Technology are increasingly reserved for software‑enabled, automation‑driven models with durable margins, recurring revenue and a customer base that treats technology as operational necessity — not for cyclical exposure or thematic labels alone.
EV/EBITDA: End market comparison Ø FY2025-FY2027
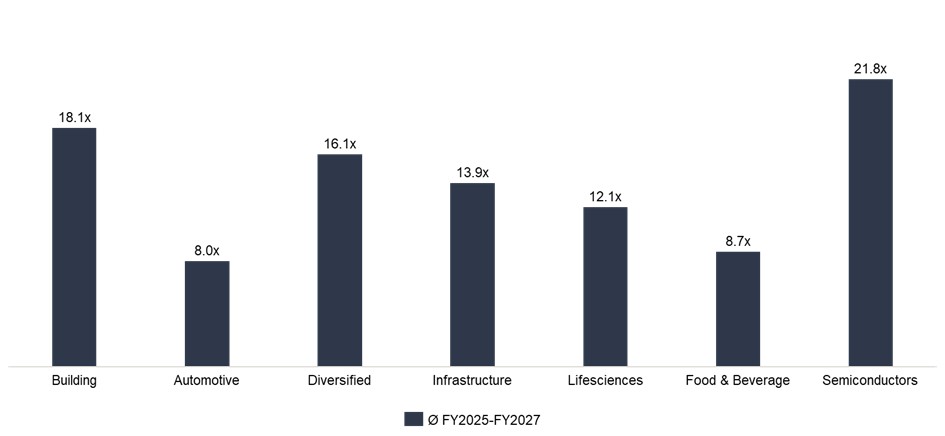
Our end‑market analysis shows that valuation is now as much about where you sell as what you sell.
- The new framework splits the universe into Building, Automotive, Diversified, Infrastructure, Lifesciences, Food & Beverage and Semiconductors, each with a distinct “lane” of mid‑cycle multiples.
- At the top, Semiconductors and Building command high‑teens to low‑20s EV/EBITDA, reflecting non‑deferrable, mission‑critical capex; Automotive and Food & Beverage sit closer to 8–9x, despite similar business models in some cases.
- Diversified and Infrastructure names form the middle of the range, anchoring the overall sector multiple but masking a clear two‑speed market underneath.
EV/EBITDA Development by sub-sector: Q1 2022 – Q4 2025
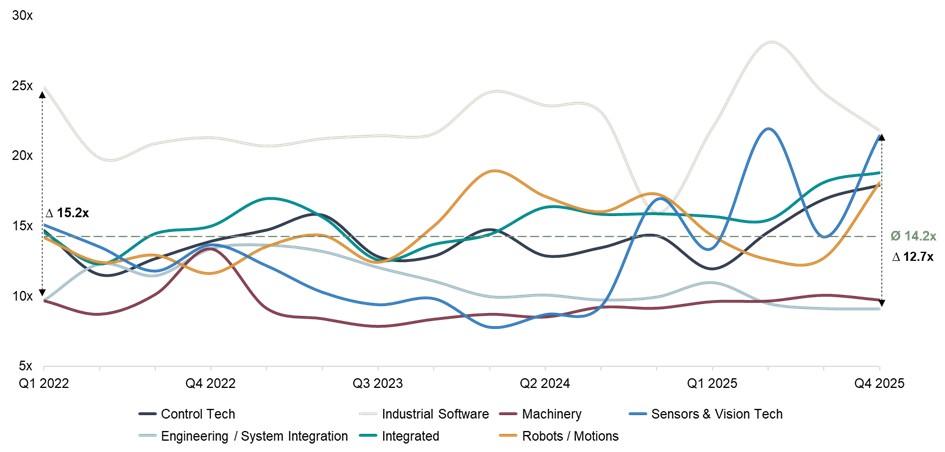
The sector has rebuilt to a healthy level — but the headline multiple masks a structural divide.
- Valuations have normalised at 16.7x EV/EBITDA in Q4 2025, ~17% above the prior year and clearly above the four-year average of ~14.2x. Six of seven sub-sectors currently trade at or above their historical averages.
- The spread tells the real story: Industrial Software at 21.8x, Engineering/SI at 9.1x — a gap of over 12x. Buyers are paying for business models and end market exposure, not sector labels.
- It’s a two-speed market: software-enabled sub-sectors serving non-cyclical end markets like Semiconductors, Building, Infrastructure and Lifesciences command teens to low-20s multiples, while hardware-intensive, project-based segments with heavy Automotive or Food & Beverage exposure cluster around 8–9x.
- Within our peer set, companies with comparable margins and similar recurring revenue shares trade 3–5x apart when their end market mix diverges — a Control Tech platform serving Building end‑markets commands a structurally different multiple than one with equivalent economics but dominant Automotive exposure. End market quality is not a secondary factor — it is a primary valuation driver in its own right.
EV/EBITDA: YoY comparison 01/2025 – 01/2026
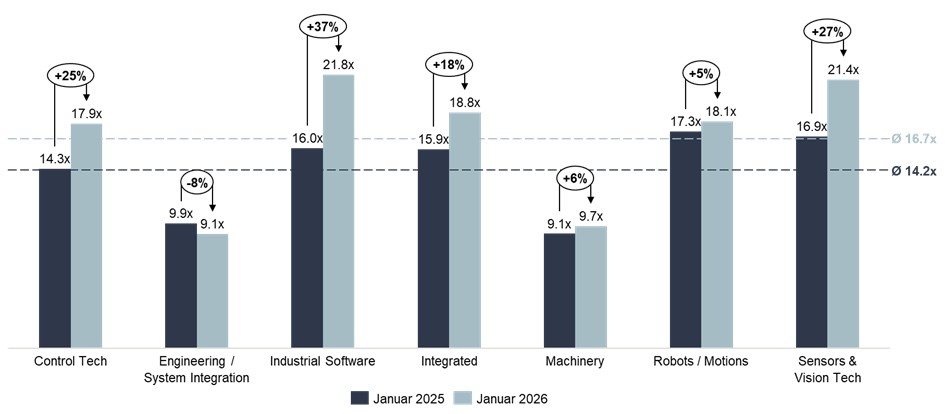
The re-rating is concentrated in software-rich models serving structurally growing, non-cyclical end markets.
- Industrial Software (+37% to 21.8x), Sensors & Vision Tech (+27% to 21.4x) and Control Tech (+25% to 17.9x) show the strongest momentum — driven by AI-embedded automation and IIoT adoption in Semiconductors, Building and Infrastructure, where capex is non-deferrable and regulation enforces technology investment.
- Integrated Conglomerates (+18% to 18.8x) benefit from diversified portfolio breadth — spanning automation, software, electrification and industrial infrastructure — and growing exposure to Building and Semiconductor end markets, where secular demand provides a durable multiple floor.
- Engineering/System Integration (−8% to 9.1x) is the only sub-sector with negative momentum — high Automotive concentration compounds the structural disadvantages of a project-based model: limited pricing power, high execution risk and cyclical order intake.
- Machinery (+6% to 9.7x) and Robots/Motions (+5% to 18.1x) appear relatively stable for now, though the divergence between them reflects the difference between predominantly Automotive-exposed equipment businesses and automation platforms increasingly deployed in Food, Logistics and general manufacturing. While EV platform transitions and battery production ramp-ups may create selective re-rating catalysts for Automotive-exposed players, the broader segment discount is unlikely to compress meaningfully without a structural shift in OEM procurement behaviour and margin-sharing dynamics.
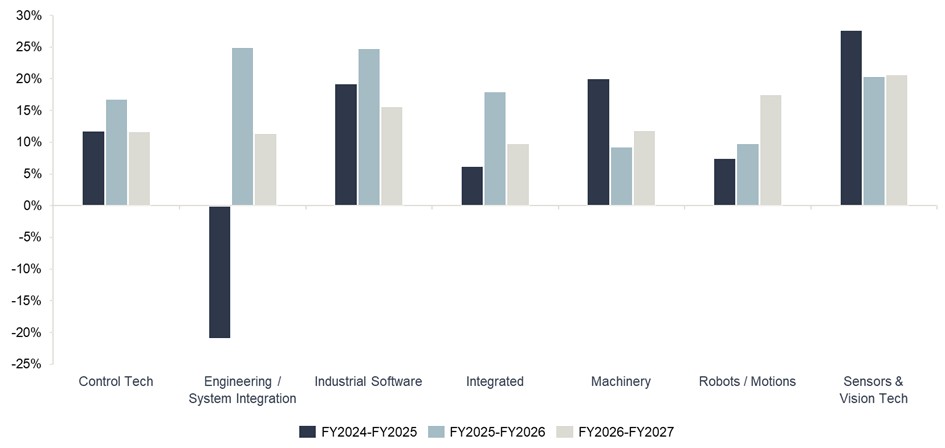
Revenue growth in % by sub-sector: 2024 – 2027E
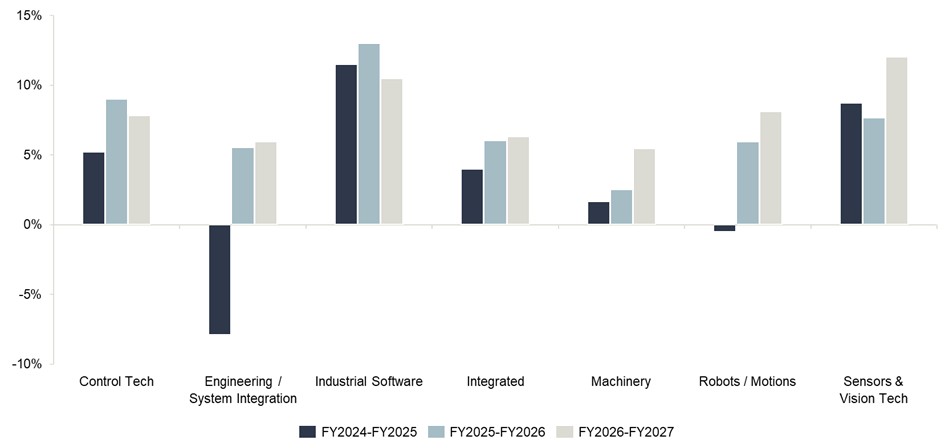
Growth quality matters as much as growth rate — end market determines how sustainably it compounds.
- Industrial Software and Sensors & Vision Tech are leading at 10–12% p.a. through 2027, driven by data, analytics and workflow-automation spend in Pharma, Healthcare and Semiconductors.
- Control Tech and Robots/Motions form the second tier at 6–9%, supported by automation intensity across non-cyclical end markets: pharma filling lines and logistics automation are structurally less sensitive to macro headwinds than Automotive capex.
- Engineering/SI recovers from −8% to mid-single-digit growth, but this is largely deferred Automotive projects catching up — not a structural improvement. As long as Automotive dominates the order book, top-line recovery does not translate into re-rating.
EBITDA growth in % by sub-sector: 2024 – 2027E
Scalable profitability — not just top-line growth — is what the market is pricing.
- Industrial Software delivers ~20% EBITDA growth transitioning to ~16% — a healthy maturity curve where initial operating leverage converts into durable profitability, reinforced by Pharma and Healthcare customers who sustain higher pricing than industrial OEMs.
- Robots/Motions accelerates to ~17% EBITDA growth by FY2027, driven by Logistics and Food automation demand — a clear signal that software economics are increasingly visible in the P&L as the platform mix shifts away from Automotive assembly.
- Engineering/SI swings from −21% to +10%, driven by restructuring and improved project selection — not structural margin expansion. The recovery remains fragile as long as Automotive dominates the order book and OEM pricing dynamics compress margins at renewal.
EBITDA-margin by sub-sector: 2022 to 2027E (in %)
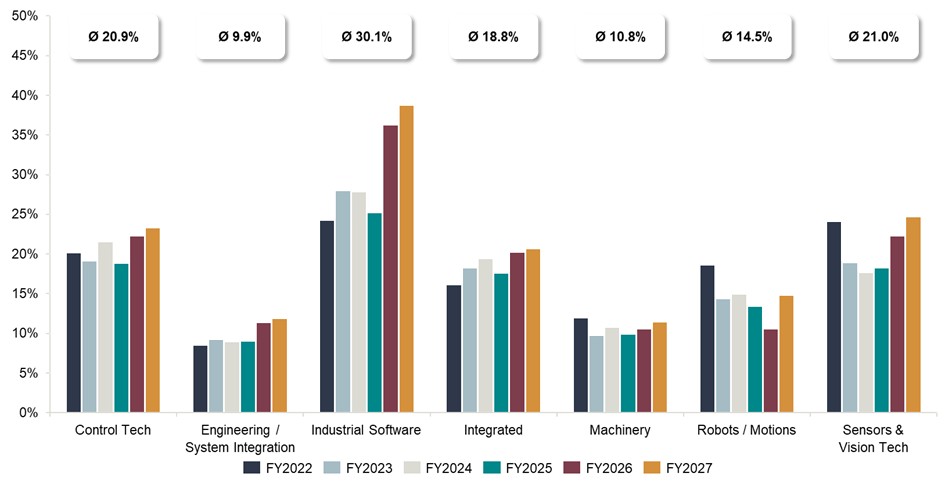
The margin gap between sub-sectors is the root cause of the valuation spread — and end markets explain much of it.
- Industrial Software improves from 24–28% toward ~40% by FY2027 (Ø 30.1%) — best-in-class software economics, further supported by end markets where customers treat software as mission-critical infrastructure and accept premium pricing accordingly.
- Sensors & Vision Tech (Ø 21.0%), Control Tech (Ø 20.9%) and Integrated Conglomerates (Ø 18.8%) sustain robust margins through diversified product portfolios, IP-rich platforms and strong aftermarket revenue — reinforced by Food, Pharma and Semiconductor end markets where downtime costs and regulatory requirements structurally strengthen pricing power.
- Engineering/SI and Machinery at ~10% average reflect a structural constraint that goes beyond the business model: Automotive OEMs systematically compress supplier margins through competitive tendering, volume pressure and cost-down programmes — creating a margin ceiling that is difficult to break without a fundamental shift in the customer base.
- Robots/Motions (Ø 14.5%) is the most asymmetric opportunity — despite today’s relatively stable multiples, it has a hybrid margin profile today but a clear trajectory toward software economics as platform deployment shifts from Automotive assembly toward Semiconductors, Logistics and Healthcare automation.
Correlation analysis – Industrial Technology
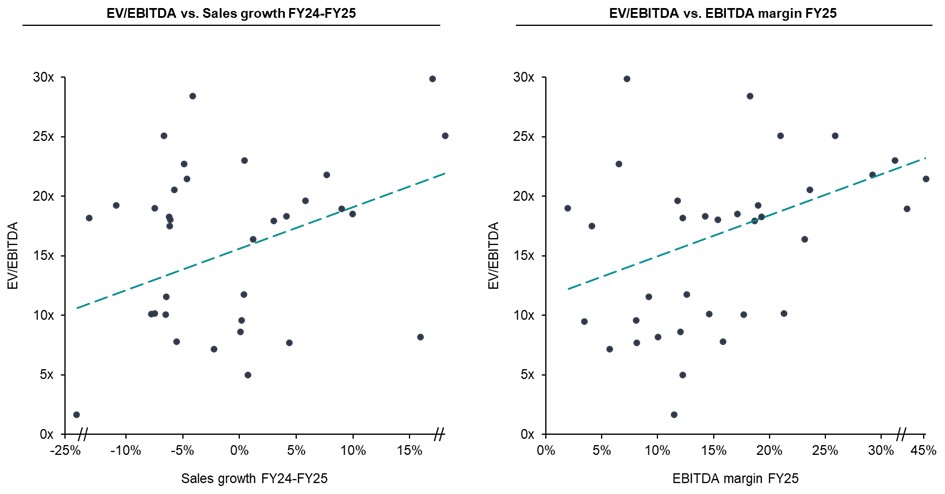
In Industrial Technology, investors reward profitable growth. Both dimensions matter equally.
- The scatter plots show a clear positive slope for both EV/EBITDA vs. sales growth (FY24–25) and EV/EBITDA vs. EBITDA margin (FY25) — and both correlations are broadly comparable in strength.
- Companies combining above-average growth with EBITDA margins above 25–30% typically trade above 20x. Double underperformers — negative growth and low margins — fall below 8x, regardless of sector label.
- End market quality acts as a third, implicit factor: companies in defensive, non-cyclical end markets show lower earnings volatility and higher margin persistence — which is visible in the upper tail of both scatter plots and directly translates into multiple resilience.
Investec Industrial Technology Index vs. S&P 500
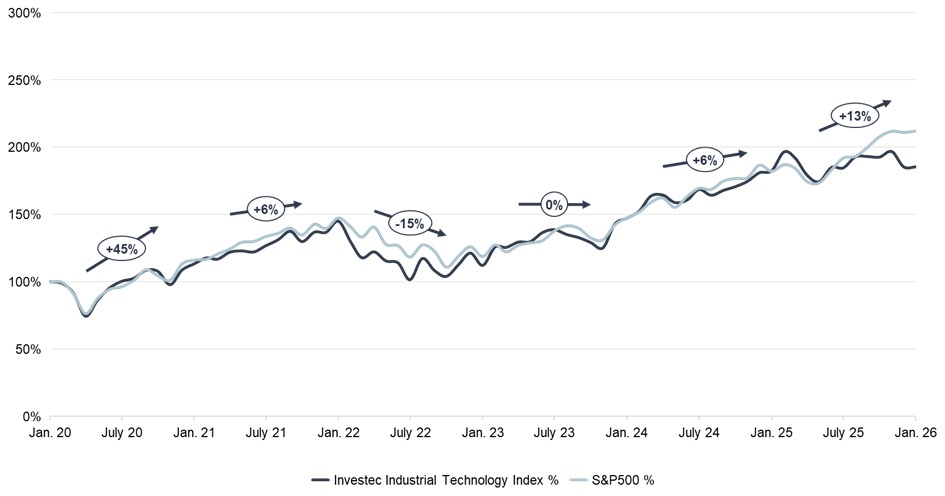
High correlation, moderate underperformance — and the right conclusion is not what it appears.
- The Investec Industrial Technology Index has tracked the S&P 500 closely across all major market phases since 2020 — COVID crash, 2021 recovery, 2022 rate correction, and the 2023–2025 rally.
- On a total return basis since January 2020, the index has underperformed the S&P 500 by ~25–30 percentage points — a gap that largely reflects the absence of high-multiple software pure-plays from the Industrial Technology peer set, not structural sector weakness.
- For private markets practitioners, the index comparison provides useful context but limited actionable signal. M&A returns are ultimately generated through operational value creation at the asset level — and that is precisely where Industrial Technology’s fragmented, margin-rich landscape creates the most compelling opportunities.
What does this mean in practice?
The data points above converge on a clear set of priorities for both sides of the transaction:
For entrepreneurs & owners
- Premium multiples require three things simultaneously: a software-enabled recurring revenue model, high-teens EBITDA margins with demonstrated persistence, and an end market mix dominated by structural non-cyclical demand — Pharma, Healthcare, Building, Semiconductors.
- The next 24 months should be used to build recurring revenue, improve EBITDA conversion, and actively diversify the customer base away from Automotive — each of these directly converts into exit valuation.
For investors & strategics
- The most powerful value creation lever available today is end market transformation: pivoting Automotive-heavy assets toward Pharma, Semiconductors and Healthcare can unlock a 6–8x multiple differential that is measurable, quantifiable and accessible through targeted add-on strategy.
- Robots/Motions offers the most asymmetric profile: entry at hardware multiples, exit potential at software multiples as platform deployment shifts toward non-cyclical, high-margin end markets. Integrated Conglomerates, meanwhile, provide portfolio resilience and multiple stability — their diversified exposure across end markets and business models makes them a natural anchor allocation rather than a re-rating play.
Sector exposure without an end market and model filter delivers average returns, not outperformance — selectivity is the only viable strategy in the current environment.
The Investec Industrial Technology Index tracks daily developments in sectors such as Control Tech, Industrial Software, Integrated Providers, Engineering, Machinery, Vision Tech & Robots/Motions. The index includes valuations, growth projections, profitability margins and other metrics. You can find more information on our website and specific industry insights in our latest Systems Integration Report.
Investec has a senior team in Industrial Technology, who are experienced experts in selling, buying, and financing businesses.
If you have questions and would like to know more about valuations, buyer activity and current opportunities in the market – please get in touch: ervin.schellenberg@investec.com, arne.laarveld@investec.com, matthias.odrobina@investec.com, yves.scharf@investec.com, constantin.waider@investec.com